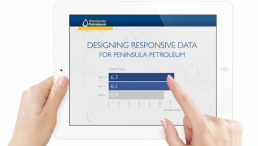
Designing responsive data
New technology is radically changing how we consume data. Access to information needs to be fast and anywhere. Additionally, the volume of information collected every day is exponentially increasing.Peninsula Petroleum (one of our long standing clients), manages a huge amount of data daily.
Not only related to to daily market fixtures, but trading and port information alike. A current ongoing project within the studio is not only visualising that data but that of a website redesign. To make sure we left no stone unturned and achieved a simple and clear representation of complex data structures we researched into new HTML5 and responsive design interactive infographics.
And we came across this effective and interesting data visualisation tool: amcharts.com. We recommend if your visualising data you should review this.

